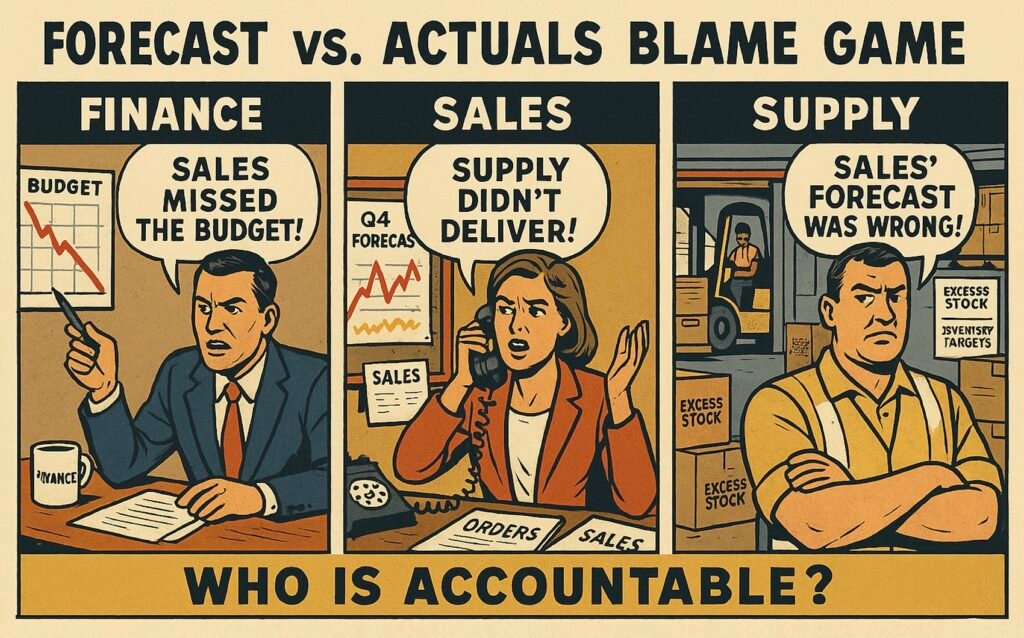
Introduction
Jeff Bezos wrote to Amazon shareholders in 2016: “Given a 10 percent chance of a 100 times payoff, you should take that bet every time. But you’re still going to be wrong nine times out of ten.”
While this statement is exaggerated for effect, the principle applies to all business decisions. Yet, most executives don’t approach decision-making this way.
Instead, they often evaluate decisions based on outcomes: a profit of $1 million indicates a good decision, while a loss of $1 million indicates a bad decision.
Though this may seem like common sense, it’s not possible to judge a decision’s quality from a single outcome.
This flawed view leads to two problems. First, categorizing things as manageable or unmanageable based on their certainty, which results in focusing on the former while neglecting the latter. Second, mislabeling good decisions as bad and vice versa, which leads to poor future decisions that will hinder performance.
The fundamental flaw is viewing business decision-making like a chess master calculating the best moves: believing that (1) an objectively right decision exists and (2) finding it depends solely on the player’s effort and skill.
In reality, business is poker, not chess: (1) objectively right decisions don’t exist, and (2) decisions involve an element of luck.
The critical error is focusing on individual decisions being ‘right,’ often manifested in an obsession with ‘hitting the plan.’
Instead, one should aim to better understand the decision odds and strive to be less wrong over time.
The Problem
According to Michael Mankins, executives claim they lose 40% of their strategy’s potential value to poor execution, while in reality, their plans are often flawed from the start and likely not worth executing.
They assume they can predict the future accurately enough to describe decision outcomes precisely and create static plans worth ‘hitting,’ without accounting for underlying uncertainty and luck—factors inherent to the real world.
Typically, this leads to dividing companies into numerous deterministic silos, where ‘hitting the plan’ means that actual values correspond to static plans made months prior—without realizing that neither is necessarily relevant for improving performance; the original figure is likely outdated, and the actual value includes an unknown amount of random noise.
Even if both were valid indicators of what performance should have been and what it was, a fundamental principle of systems thinking is ignored: it is not possible to maximize the performance of the whole by improving the performance of the parts.
This happens because of four fundamental factors: a flawed view of the world, assumptions that determine the ‘odds to win,’ the challenges of learning under uncertainty, and a focus on individual outcomes that hinders overall performance.
A Flawed View of the World
Executives obsess over hitting static plans because they view the world as deterministic when, in reality, it is probabilistic—shaped by uncertainty and luck.
While this may seem trivial, it was also proven by Edward Lorenz in 1963 and popularized in his 1972 paper, where he coined the famous butterfly effect, often misunderstood to mean ‘small events can have big impacts.’
Michael Mankins summarized the deeper implications for business: In complex systems, small changes in one variable may have no effect or a massive effect, making it practically impossible to predict what will happen.
In other words, the way executives plan fails to account for the unpredictability of the future, a fundamental characteristic of the real world—something that no amount of budget revisions, better forecasts, or improved ‘execution’ can overcome.
This means that “uncertain systems, by definition, respond differently every time, to the same input.” Therefore, in business, a plan to sell $100 million can result in, for example, $95 million or $105 million in sales with the exact same level of execution.
Not understanding this leads to approaching planning and decision-making in business like chess: (1) an objectively ‘right decision’ exists in every situation, and (2) finding it depends solely on the player’s effort and skill. However, as Annie Duke puts it, “life is poker, not chess.”
Business decisions are like hands in poker: they have numerous possible outcomes, with probabilities attached to them, depending on real-world factors (assumptions) relevant to that decision (hand).
However, executives often miscategorize events as either manageable or unmanageable based on their certainty: events far in the future cannot be managed since ‘it’s impossible to plan that far,’ leading to a myopic focus on the short term.
In other words, they fail to understand that “it is one thing to recognize the limits on predictability, and quite another to dismiss all prediction as an exercise in futility.”
They tend to mislabel decisions based on outcomes—a $1 million profit is seen as a good decision, and a $1 million loss as a bad one. This is known as ‘resulting’ or ‘outcome bias,’ which Cassie Kozyrkov calls “the most important concept in decision analysis” and “one of society’s favorite forms of mass irrationality.”
While it seems intuitive to judge decision quality by its outcome, a single result doesn’t provide enough information. Since this is counterintuitive, executives may dismiss probabilistic thinking as ‘theoretical,’ like a novice poker player ignoring odds.
However, all decision-making is probabilistic, whether they accept it or not. By limiting themselves to 0% and 100% while competitors use the full range, they miss opportunities and lose more ‘hands.’
Understanding this presents a Catch-22, as probabilistic thinking is not a black-and-white switch that makes you right all the time: it’s subtle, negligible in the short term, but has a massive impact over the long term.
As Aaron Brown, a chief risk manager of a hedge fund overseeing over $100 billion, put it: “It’s hard to see because it is not dramatic, but if sustained, it’s the difference between making a living or going broke.”
Or, as described by a world-class poker player: “the difference between heavyweights and amateurs is that the heavyweights know the difference between a 60/40 bet and a 40/60 bet.”
Indeed, the real world is probabilistic, yet executives’ mindsets—and their plans—often act as if it were deterministic. While that may sound ‘theoretical,’ it ironically might be the practical root cause that prevents improvement.
Assumptions Determine the ‘Odds to Win’
According to Rita McGrath, “Even the best companies can run into serious trouble if they don’t recognize the assumptions buried in their plans.”
By definition, plans are only valid under specific assumptions. There is no such thing as ‘not assuming,’ as that would imply outcomes are equally likely regardless of decisions made or real-world factors, which is ‘stupid on its face.’
For example, consider a scenario where a product team assumes new sustainable products will generate $100 million in sales. The likelihood of achieving this depends on the underlying assumptions.
If there is a 90% chance that the sustainable product segment will grow by more than 20%, there could be a 90% probability that sales will exceed $100 million.
However, if there is only a 10% chance that the market will grow by more than 15%, there may be a 90% probability that sales are less than $100 million.
Depending on the market assumptions, the plan to sell $100 million could be a P10, P50, or P90, with expected values ranging, for example, from $95 million to $105 million (Table 1).

Table 1.
Debating static numbers, such as $100 million in sales, without making the underlying assumptions and probabilities explicit, is fundamentally flawed because business outcomes are probabilistic and driven by real-world factors.
According to McKinsey, “in many FP&A models, however, probability levels are applied haphazardly or not at all, which can lead to very poor decisions.” The resulting plans are flawed from the start because they rely on specific assumptions that have a low probability of occurring.
Whether the plan is P10, P50, or P90, the likelihood of hitting exactly $100 million in sales is practically nonexistent, as it would require a specific market growth rate, like 15.0%
Even if we consider a range that wouldn’t account for a ‘gap,’ say $99 million to $101 million, the likelihood remains low—perhaps in the 10% to 20% range—because it would require a narrow market growth range, like 13.8% to 16.1%.
And that’s just one assumption. In reality, plans rely on several assumptions. For example, a plan to launch new sustainable products might rely on the assumption that consumers will accept a 10% price increase.
Similarly, there could be a 30% chance consumers accept a price increase over 10%, a 60% chance they’ll accept 0% to 10%, and a 10% chance they’ll demand lower prices (for example due to weaker product features).
The specific ranges or probabilities aren’t the main point—adding assumptions quickly drives the likelihood of a static plan remaining valid to near zero.
Even if we assume the plan would remain valid at the 50% confidence interval for each assumption, with just five assumptions, there may be a 97% chance the plan would become invalid; with ten assumptions, the likelihood can exceed 99.9%.
Disclaimer: This is a simplified example, and real-world calculations involve more complexity.
Moreover, the larger the business decision, the more this holds true. Ironically, the higher you are in the organization, the greater the role luck plays in the outcomes of your decisions, as they are more dependent on assumptions outside the company’s control.
Learning Under Uncertainty Is Not Trivial
As Tom Chivers summarized it, “Without some sense of how probable something was before you saw the evidence, you can’t make any claims about how likely it is after seeing the evidence…That’s true when we’re making decisions in the real world, just as it is with scientific and statistical questions.”
In probabilistic systems, such as the real world, good decisions can result in bad outcomes, and bad decisions can result in good outcomes, making learning in these environments challenging.
Consider a game of poker: You win a hand with a pair of eights (spades and hearts) when the community cards are the 10 of spades, 8 of hearts, king of spades, queen of clubs, and ace of hearts (Picture 1).
Did you win because of great decisions, or were you lucky?

Picture 1.
For simplicity, let’s assume there is only one other player and disregard factors like bluffing. Over the long term, your probability of winning in this situation is about 40% after the flop, 30% after the turn, and 10% after the river (Pictures 2, 3, and 4).

Picture 2.

Picture 3.

Picture 4.
However, the probability of winning a particular hand can vary greatly—from 0% to 100%—at different stages, depending on the other player’s cards.
For instance, if the other player holds a 10 of spades and a king of clubs, your chance of winning after the flop drops to less than 10%. Conversely, if they have a 2 of spades and a 7 of spades, your chances rise to over 90% (Pictures 5 and 6).

Picture 5.

Picture 6.
In the latter case, after the turn card, your probability of winning is 100%, while in the former, it’s only 5%. After the river, your chances could either be 100% or 0% (Pictures 7, 8, 9, and 10).

Picture 7.

Picture 8.

Picture 9.

Picture 10.
(Pictures 1-10 from: https://www.pokernews.com/poker-tools/poker-odds-calculator.htm, no affiliation)
Since you can never know the community cards in advance and can’t see the other player’s cards, it’s impossible to be certain of the exact odds in an individual game or decision.
This same uncertainty applies to learning in business as well.
For example, if a company expects $10 million in sales from a new sustainable product launch but it only generates $8 million, was the launch a failure?
As in poker, based on a single outcome, the correct conclusion is ‘not sure.’
This is because, although the expected outcome, and the actual are often expressed as a single figure, they are in fact both an actualizations of a probability distributions.
While two precise figures create the illusion of a meaningful gap, it’s impossible to determine from single value what type of probability distribution the outcome represents or how large the gap is to the estimated value.
For example, consider Pictures 11, 12 and 13.
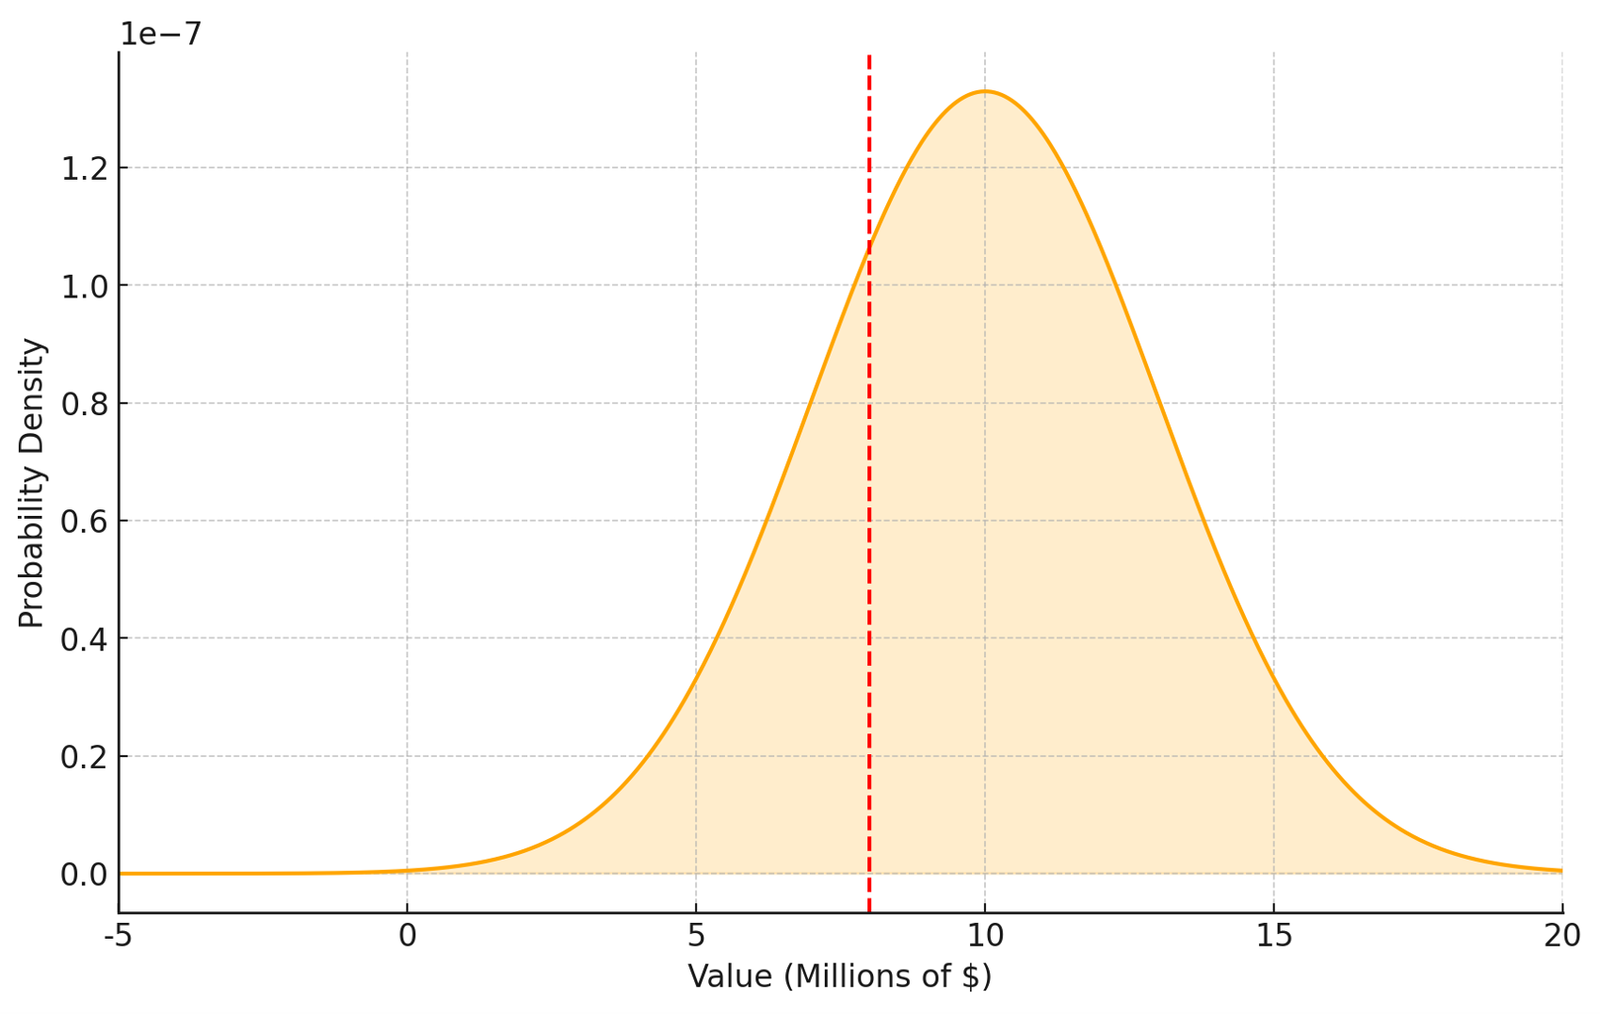
Picture 1.
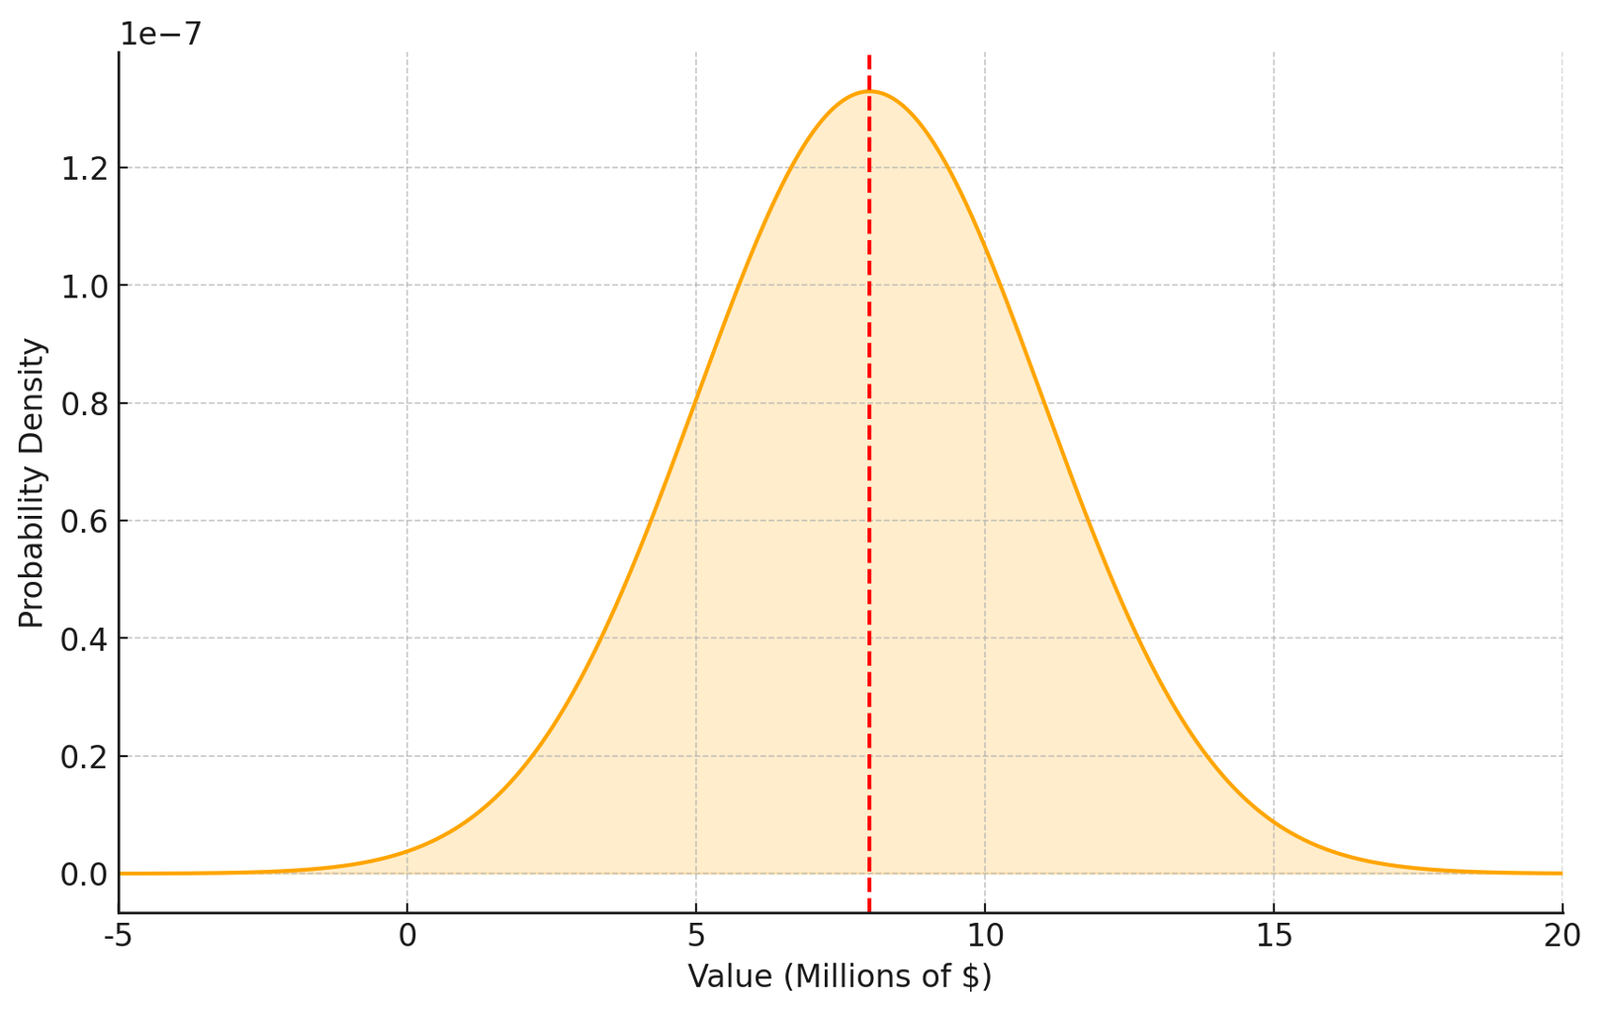
Picture 12.
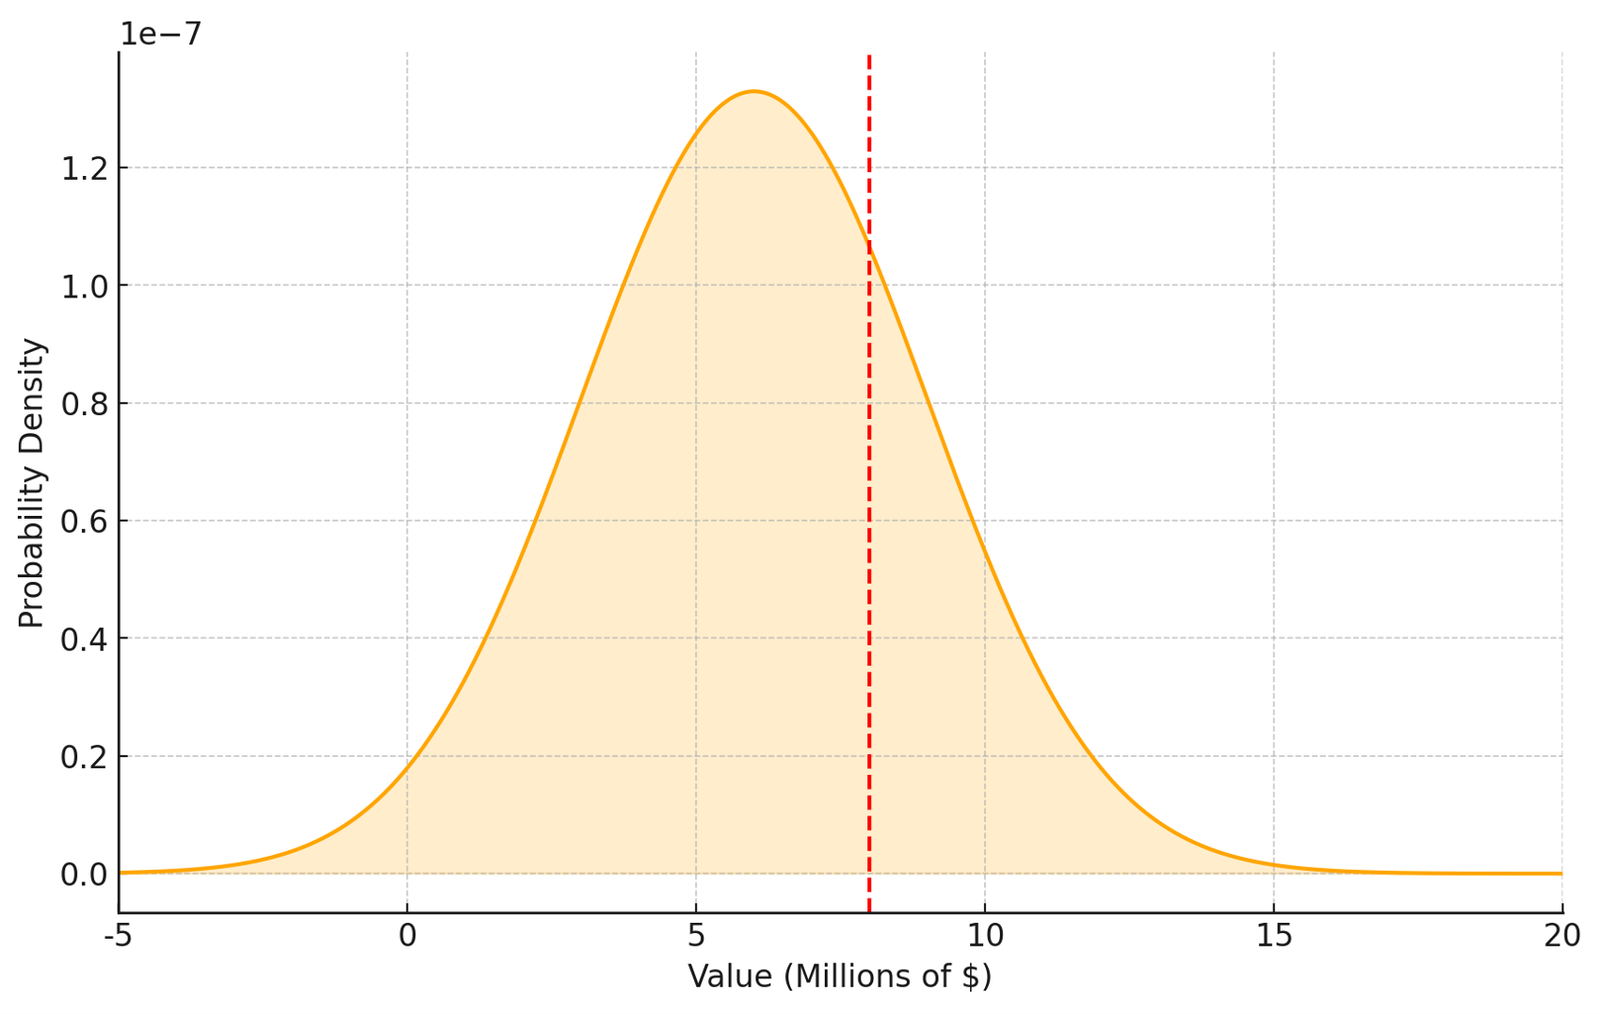
Picture 3.
The same observed $8 million in sales could represent a distribution where the expected sales are $10 million (Picture 11), $8 million (Picture 12), or $6 million (Picture 13).
Correspondingly, the gaps to expected values would be -$2 million, $0, and $2 million, and the likelihoods that future outcomes would exceed the originally estimated $10 million may be 50%, 25%, and 10%.
These are simplified examples to illustrate the point. In reality, the $8 million figure could represent any type of distribution with any expected value, and therefore it’s impossible to determine the likelihood it occurred.
The same uncertainty applies to all business outcomes, like month-end closings and gap analyses. For example, if the budget was $100 million and actual sales were $95 million, does the $5 million gap indicate poor performance?
Setting aside the inherent flaws in annual budgeting, which often render the budget number itself ‘non-sensical,’ the correct conclusion is, once again, ‘not sure.’ This is because it’s impossible to determine how much of the actual figure represents noise.
An astute reader might ask, wouldn’t investigating the changes in assumptions resolve this?
For instance, if the market was expected to grow by 20% but it grew only 15%, one might conclude that the $5 million gap is due to changed market conditions.
However, while investigating changes in assumptions can improve the odds of determining whether a particular gap is meaningful, it can never provide certainty or even necessarily a high level of confidence.
Even if actual market growth differs from the assumption and results in a negative impact of $5 million, it’s still unclear whether this outcome reflects a probability distribution with an expected value of $100 million or $105 million, for instance.
There can always be other unknown underlying factors that affect results.
Maybe delayed stocking in stores left shelves empty 10% of the time, competitors ran discount campaigns, store clerks recommended competitor products to clear out slow-moving SKUs, or consumers disliked a particular marketing campaign.
Or it could be a combination of small, unlikely factors that converged in this specific outcome but won’t affect the next 11-month closings, which may follow a $105 million sales distribution even with market growth of 15%.
This is the butterfly effect in action, which is why executives often say, “it’s impossible to describe all relevant assumptions.” And they’re right—it is. As Edward Lorenz demonstrated, predicting outcomes precisely is impossible because not all influencing factors can be accounted for.
That’s why simply describing assumptions and investigating changes in them is inadequate for effective learning in probabilistic environments like business.
Focus on Individual Outcomes Hinders Overall Performance
As partners from Bain and Co bottom-lined it, “Ultimately, a company’s value is the sum of the decisions it makes and executes.”
According to McKinsey, only 28% of executives encourage taking on high-potential, risky projects, while those companies that do this are more likely than others to outperform their peers on revenue growth and return on capital.
A flawed view of the world, coupled with the ‘non-triviality of learning,’ leads to, at best, ineffective, and at worst, actively harmful ‘performance management.’
This happens when executives focus on improving individual outcomes rather than improving overall performance, which comes in several forms.
The most basic form of this is the preference to maximize the number of positive outcomes over expected value. Imagine two options. Option 1 has a 90% probability of winning a $50 million deal, and Option 2 has a 50% probability of winning a $100 million deal.
Choosing Option 1 has a positive outcome 9 times out of 10, with an expected value of $45 million, while choosing Option 2 has a positive outcome only 5 times out of 10, but an expected value of $50 million.
Many may prefer Option 1 because it frequently results in $50 million, whereas Option 2 often yields $0. However, despite Option 2’s more frequent losses, it has a 6% higher expected value over time.
The same principle applies to groups of decisions.
For example, consider a company with 10 business units (BUs). According to McKinsey, many companies allocate resources by ‘spreading the peanut butter,’ distributing them evenly across BUs based on the previous year.
In reality, however, the odds are that only 1 out of 10 business units has the potential to significantly outperform the competition in growth and consequently move the entire company up the ‘power curve.’
This ‘spreading the peanut butter’ approach to resource allocation reflects a risk-averse mindset, focusing on avoiding ‘bad outcomes’ in any business unit rather than maximizing the overall expected value across all units.
Similarly, companies often struggle to account for how decision interdependencies across silos affect overall performance.
Take a case where decreased manufacturing output was caused by increased changeovers due to a broader product mix. The team found that a perfect forecast would have the same effect as removing 4% of the least profitable products.
Focusing only on operations leads to relying on forecast improvements (low impact, low odds). However, a holistic approach—such as simplifying the product portfolio—could achieve the same or better results with higher impact and likelihood.
The flaw with static plans is that they divide the whole into deterministic silos. When executives talk about ‘hitting the plan,’ they often mean reaching multiple siloed short-term targets, rather than pursuing holistic long-term strategic objectives.
At best, they focus on a single key number for the year, ignoring the effects on years 2, 3, and 4. And even then, business unit and function heads have at least one different target specific to their area.
Even if each target makes sense on its own, achieving them individually won’t maximize the company’s performance. Or, in the words of Russell Ackoff, “if we have a system of improvement that is directed at improving the parts taken separately, you can be absolutely sure that the performance of the whole will not be improved.”
Further, it increases the odds that time and energy are wasted on analyzing and reacting to meaningless noise.
Consider a company with 10 business units, each estimating $10 million in sales per month (simplified for clarity). Sales vary due to random factors, with a standard deviation of $0.5 million. This means that roughly 30% of the time, actual sales will naturally vary by more than $0.5 million from the estimate purely by chance.
In other words, these variances contain no meaningful new information; they simply reflect the original estimation.
Let’s say that over the year, out of 120 monthly sales data points, 60 deviate by more than $0.5 million from the estimate. The company has a policy of performing root-cause analyses for all deviations over 5%, so they investigate them.
However, due to the nature of the business, it is expected that about 40 of the 60 deviations, or two-thirds, are likely to be random noise. In other words, the company is wasting two-thirds of its performance management efforts investigating random noise—akin to searching for messages from alien life in TV static.
At worst, executives demanding that the organization ‘close the gaps’ waste resources that could be better used to grow the business. They may even make decisions that hinder growth, such as giving unnecessary discounts or pushing low-profit, high-complexity products—akin to building a device capable of replying to the aliens.
The Solution
As Annie Duke put it: “Making better decisions starts with understanding this: uncertainty can work a lot of mischief.”
According to McKinsey, probability-weighted, scenario-based forecasts produce the most reliable results, and investing in low-probability, high-payoff projects correlates with organizations outperforming their competitors on revenue growth.
To be effective, planning must focus on improving the odds that decisions will ‘win’ by learning and adapting, rather than predicting the unpredictable and obsessing over ‘hitting the plan.’
Probabilistic thinking is not new or revolutionary. The methods for making good decisions under uncertainty have been well understood since the 1960s, and numerous well-managed companies have implemented them successfully, even though most have not.
To improve the ‘odds of winning,’ executives must learn the basics of probabilistic thinking, make probabilities explicit, learn from multiple outcomes over time, and focus on maximizing expected value in the long term.
Learn the Basics of Probabilistic Thinking
“Whether you think you can, or you think you can’t—you’re right.”
Research shows that the ability to think probabilistically and change one’s mind in the face of new information determines how well one can predict the future.
Rather than acting as if the world is deterministic and wondering why it doesn’t work, one should accept that it’s not—and learn to use that to their advantage.
While that may seem like ‘theoretical’ advice, probabilistic thinking is essential for understanding how the real world works and a tool to make everything predictable.
The fact that best distinguishes superforecasters from others is that they believe estimating probabilities of real-world events are a skill that can be learned.
As Philip Tetlock wrote: “Foresight isn’t a mysterious gift bestowed at birth. It is the product of particular ways of thinking, of gathering information, of updating beliefs. These habits of thought can be learned by any intelligent, thoughtful, determined person.”
Put differently, if you believe that probabilistic thinking is ‘theoretical’ or too difficult, you’re right—it is, to you. However, if you believe that it is a skill that can be learned to improve decision-making, you’re also right.
Regardless of what you believe, you’ll be at a disadvantage without it.
As Charlie Munger phrased it: “If you don’t get this elementary, but mildly unnatural, mathematics of elementary probability into your repertoire, then you go through a long life like a one-legged man in an ass-kicking contest. You’re giving a huge advantage to everybody else.”
Here’s a simple test by Tom Chivers. Imagine a cancer test that is 99% accurate: it correctly identifies 99% who have cancer and correctly identifies 99% who don’t have cancer. Despite that, 99% of people it says have cancer don’t.
If you can explain why, you may be literate in probabilistic thinking. If not, understanding is likely your issue, and you might need to study the basics.
Good books to read: Everything Is Predictable: How Bayesian Statistics Explain Our World by Tom Chivers or Bayesian Statistics the Fun Way: Understanding Statistics and Probability with Star Wars, LEGO, and Rubber Ducks by Will Kurt.
Probabilistic thinking is non-intuitive and hard, so unless you’re already acting accordingly, it pays to study the basics. Without an elementary understanding, it’s hard to implement in practice.
While it’s essential to have some basic knowledge, it is far more important to start using probabilities in practice. As the old saying goes, “It’s easier to act your way into a new way of thinking than to think your way into a new way of acting.”
A good place to start is by making the probabilities explicit.
Make the Probabilities Explicit
According to a McKinsey survey, acknowledgment of uncertainty in forecasts matters.
Respondents who say their organizations’ financial forecasts for all projects include a range of outcomes are 1.7 times more likely than those who don’t to say their organizations outperform on both revenue growth and return on capital.
Similarly, a major takeaway from forecasting tournaments is that when people make probabilities explicit, they can learn to make better predictions.
Furthermore, accurately predicting the future requires the use of numbers: clearly stated terms and timelines. And since all decisions rely on probabilities, making them explicit is a tool to improve decision-making.
Making probabilities explicit is critical because, as Ackoff, Martin and Kozyrkov have argued, without documenting the relevant assumptions in advance, people are prone to hindsight bias—forgetting what the original assumptions and their probabilities were, or adjusting them to fit whatever happened afterward.
A practical place to start is with the business outcomes one wants to improve.
For example, month-end results or new product launches. Instead of stating outcomes as a single figure, such as $10 million, one should use probabilities that cover all possible outcomes.
For instance, there may be a 25% probability that sales will be $8 million or less, a 50% probability that sales will be between $8 million and $12 million, and a 25% probability that sales will be $12 million or more.
The specific numbers aren’t the point, but there are few reasons to use three brackets of 25%, 50%, and 25%. First, these three categories are simple and align with the common language of high, low, and most-likely scenarios, familiar to most.
Second, while 25% is arbitrary, it’s significantly smaller than the most-likely bracket but still large enough to be meaningful. While unlikely, it’s not so rare to be mostly academic, like the odds of an alien invasion or even once in a century pandemic.
Instead, it happens often enough that executives should understand its business implications. Further, the symmetry of high and low scenarios ensures that you’re equally likely to be positively or negatively ‘surprised.’
Third, while advanced systems can improve estimates for large data sets, simple three-category methods can be managed with pen and paper, avoiding the excuse of needing a new system to get started.
Finally, using consistent probability brackets for all decisions offers a significant advantage when learning from multiple outcomes, as will be explained later.
In addition to key outcomes, one should use probabilities for the core assumptions. A good starting place is the list of reasons for underperformance, as described here.
For example, instead of stating future segment growth is 25%, one could say there’s a 50% chance it will be 20-30%, a 25% chance it will be less than 20%, and a 25% chance it will exceed 30%.
But how do you determine the probabilities? There is a simple two-step formula to get started. First, determine the base rate (outside view). Second, revise that based on specific differences in your situation compared to the outside view.
For example, sustainable products in other markets may have grown 15% to 25% in 50% of markets, less than 15% in 25% of markets, and more than 25% in 25% of markets—this is your base rate.
You adjust the growth rates higher based on the added information that, in your specific market, the government is passing stricter restrictions on legacy products than in other markets, which will provide the probabilities described earlier.
The key is to understand that making probabilities explicit is not beneficial only if you get them ‘right,’ or even ‘close.’ It will be beneficial if you are able to improve your current understanding, which you are already basing decisions on.
Similar to assumptions, simply debating probabilities will likely improve your current understanding, even if not by refining the likelihoods themselves, but at the very least by aligning stakeholders’ perspectives—and consequently their actions.
Further, according to McKinsey, “Being clear about probability values, on the other hand, has second-order benefits. Identifying, for example, a 60 percent probability is a helpful spur to understand what it would take to achieve much higher probability.”
Moreover, when one business unit head presents results using probability values and confidence levels, it encourages others to do the same, improving alignment across the organization.
Finally, there should always be a single, designated owner of the model. Without someone responsible for validating the probability values, they may not be as reliable as they appear, even if they are included in the model.
Learn from Multiple of Outcomes Over Time
If good decisions can have bad outcomes, and luck is always an element, how can you tell if decisions were good, and what can you do to improve decision-making?
Simple answer: focus on learning from multiple outcomes over time. It’s an essential criterion if one is serious about improving predicting the future.
Consider the earlier case where there was a 25% probability that sales would be $8 million or less, a 50% probability that sales would be between $8 million and $12 million, and a 25% probability that sales would be $12 million or more.
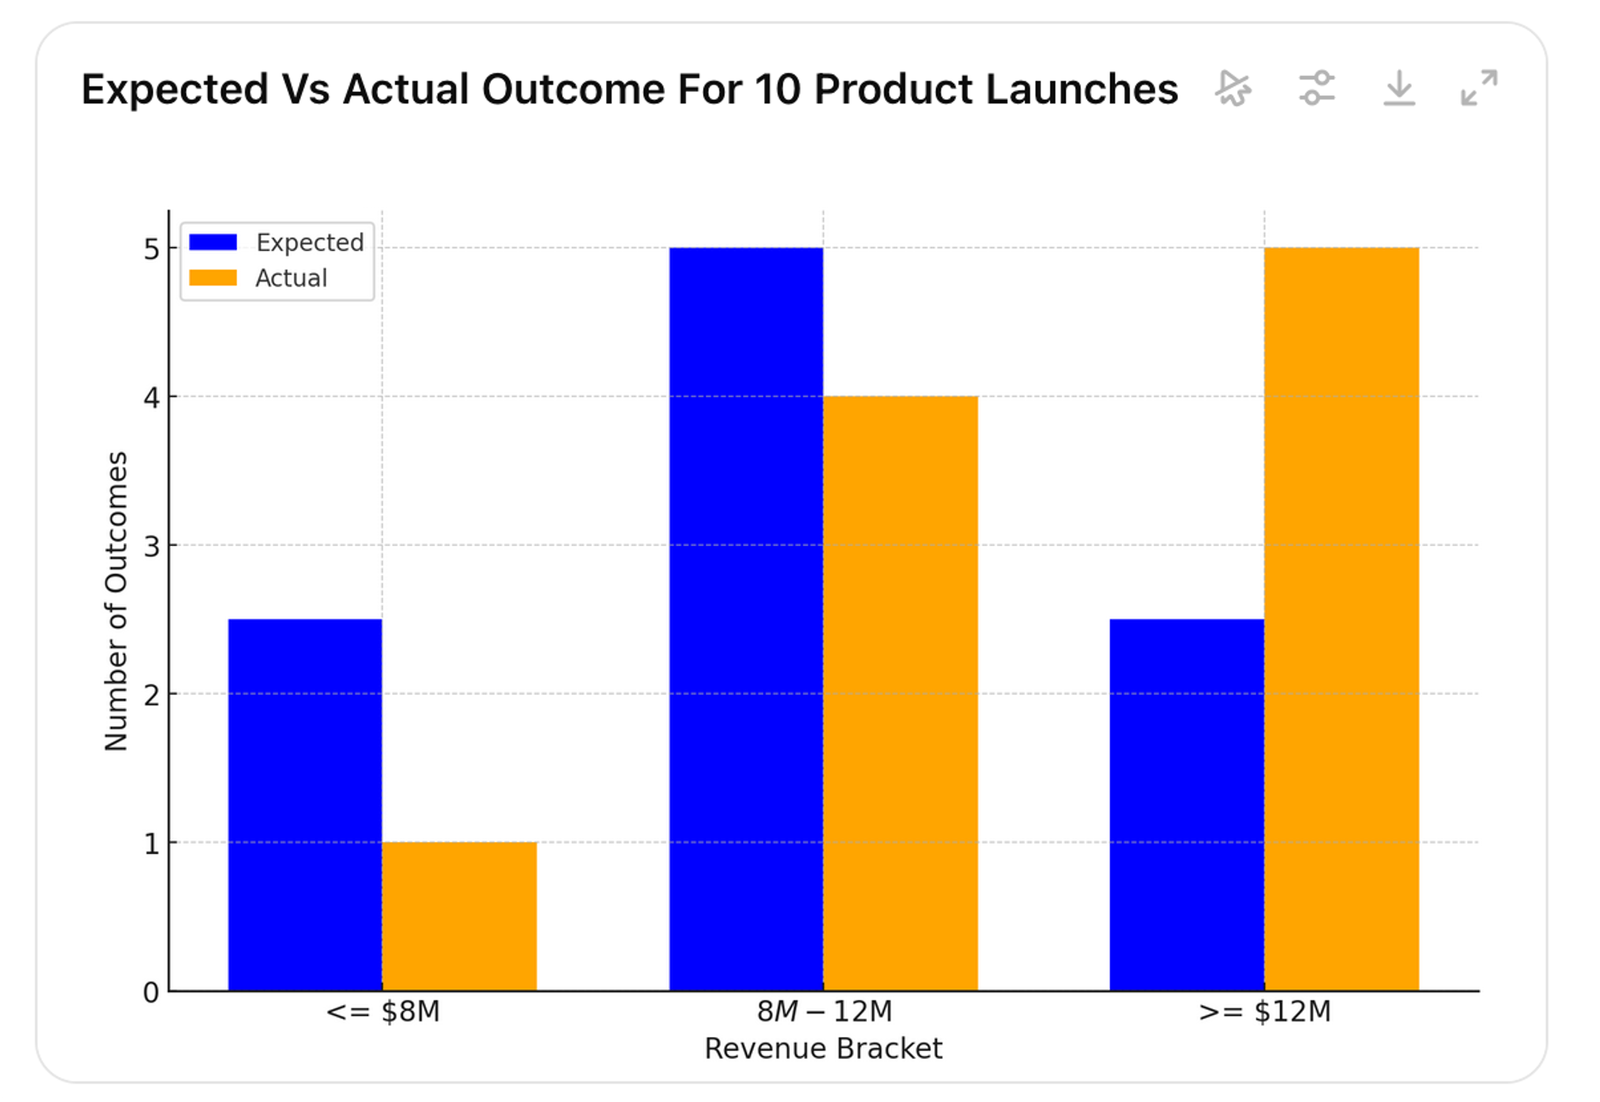
Regardless of the probabilities, after one product launch, the actual value could fall into any of the estimated probability brackets (pictures 14 to 16).
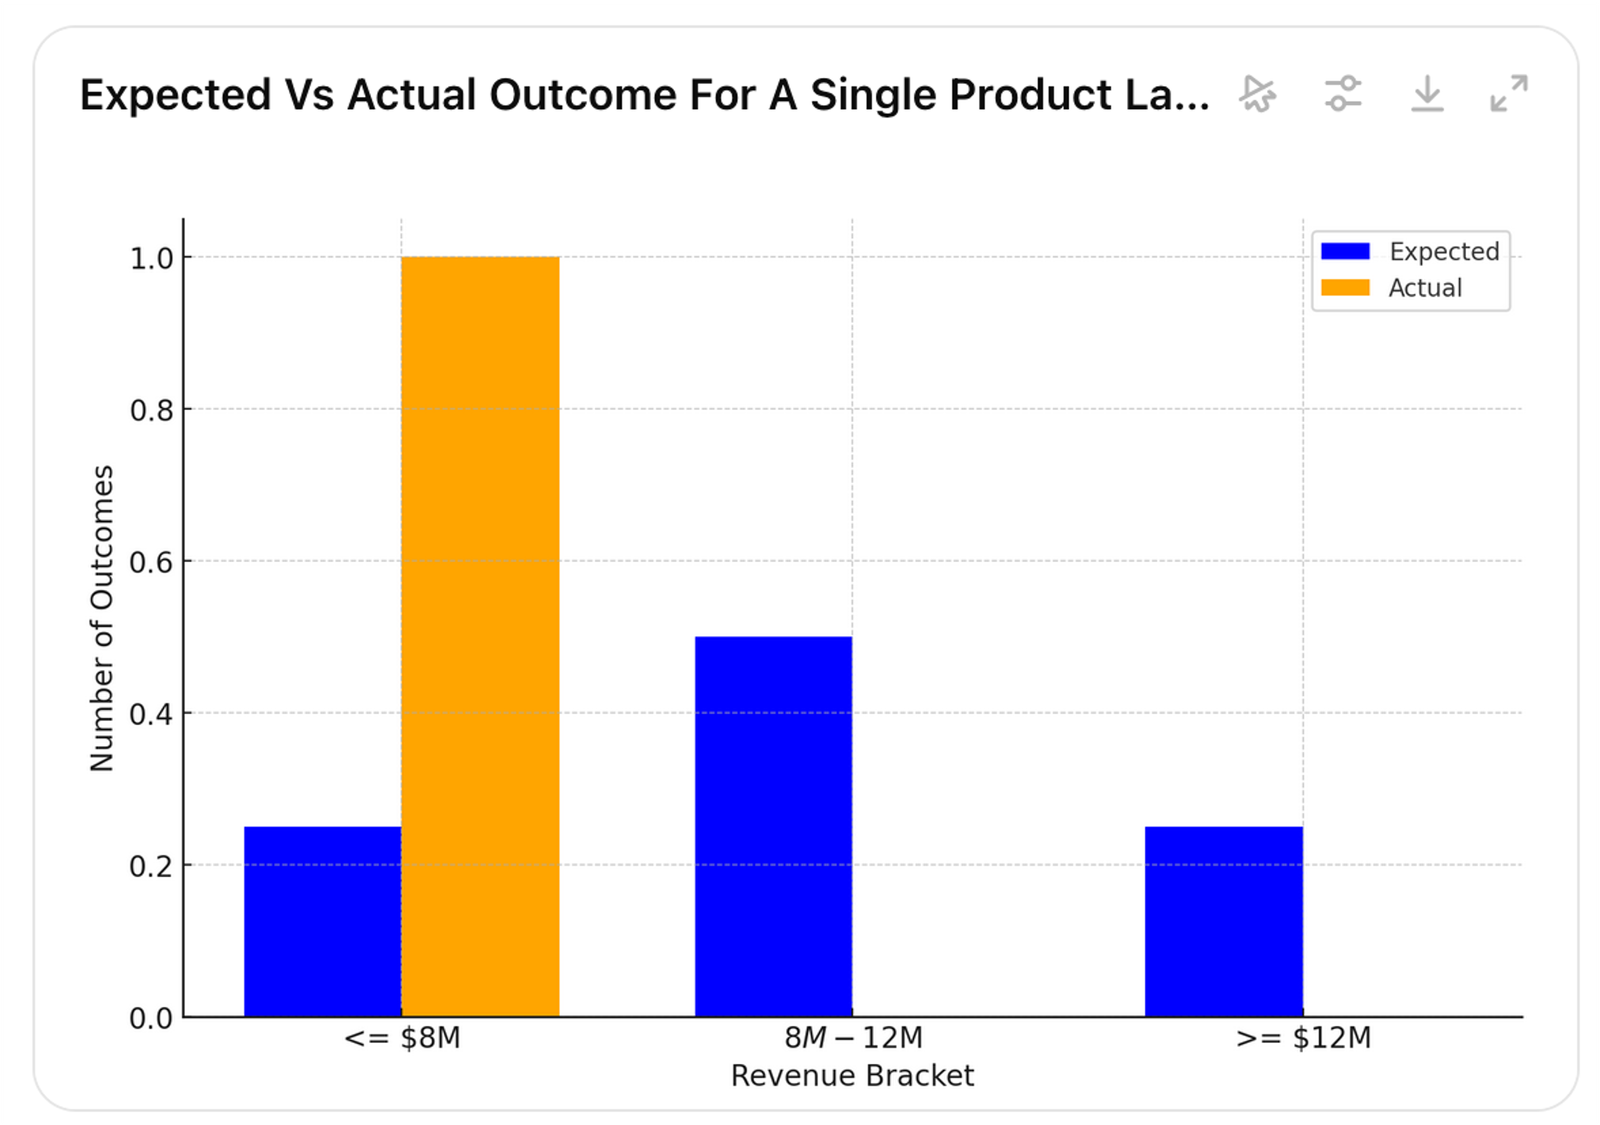
Picture 14.
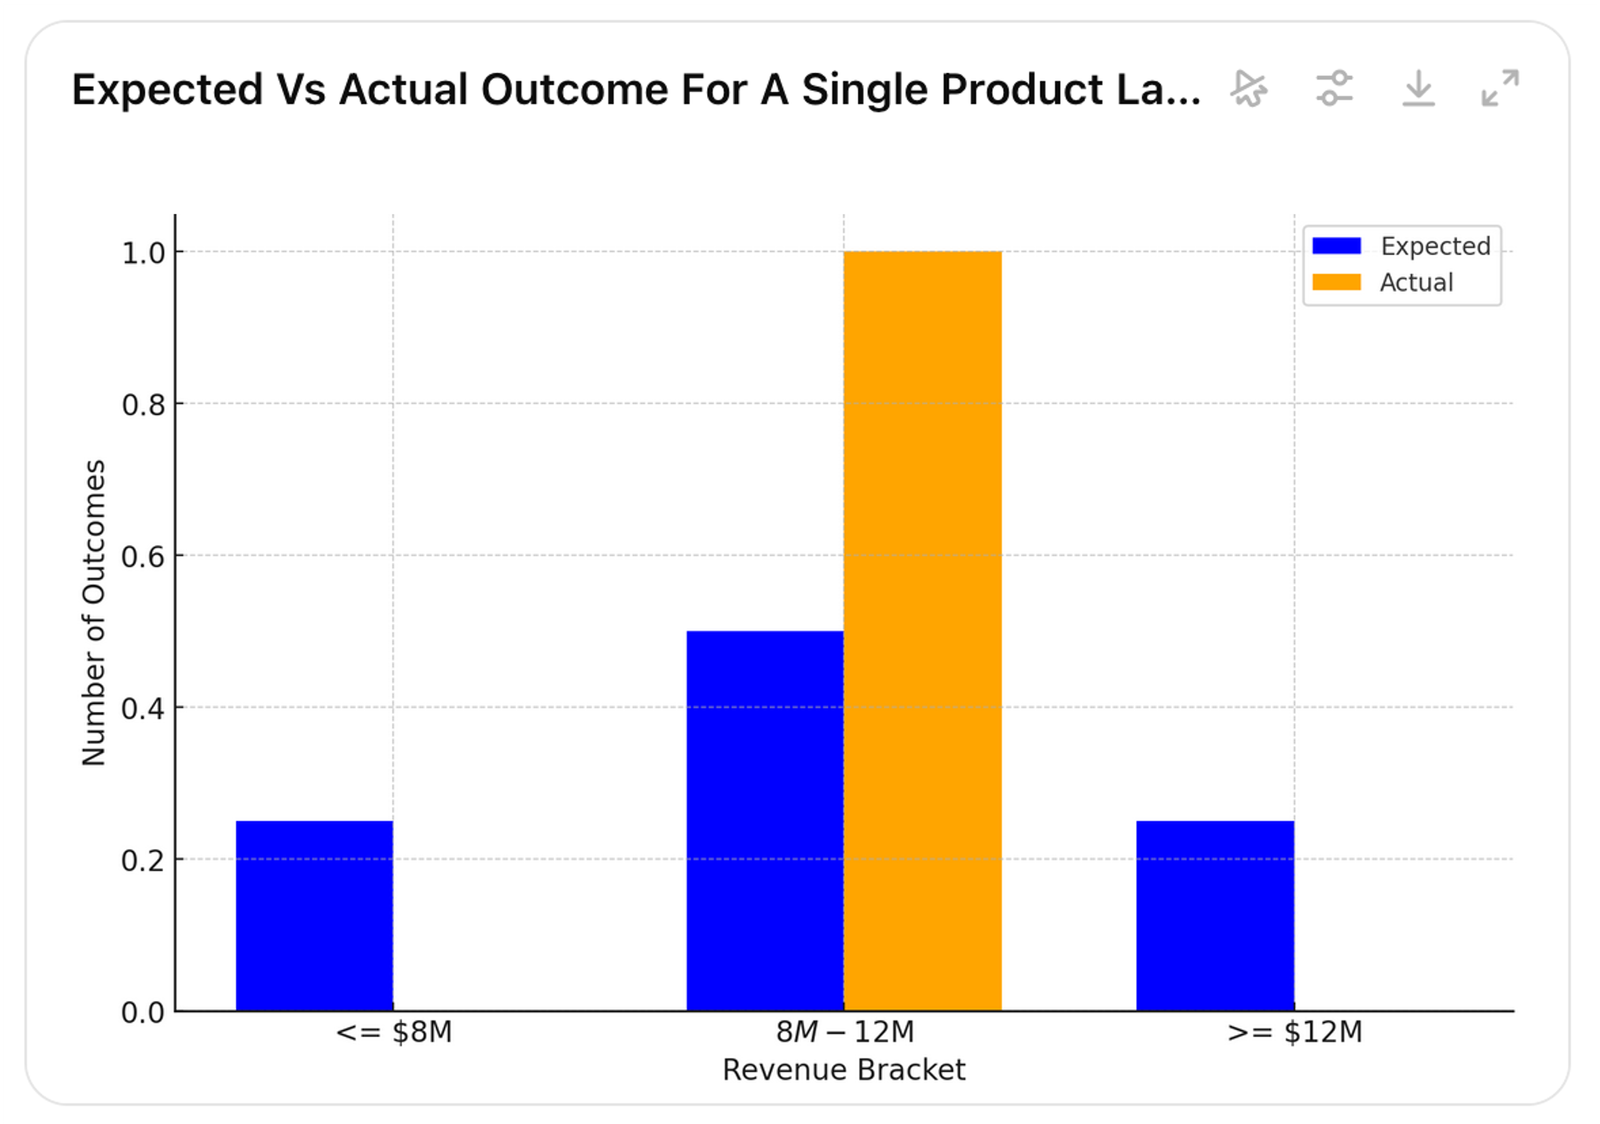
Picture 15.

Picture 16.
However, after multiple product launches, we are likely to see one of the patterns in pictures 17, 18, or 19 (it is of course also possible that all brackets would be equally likely or the extremes would be more likely than the middle).
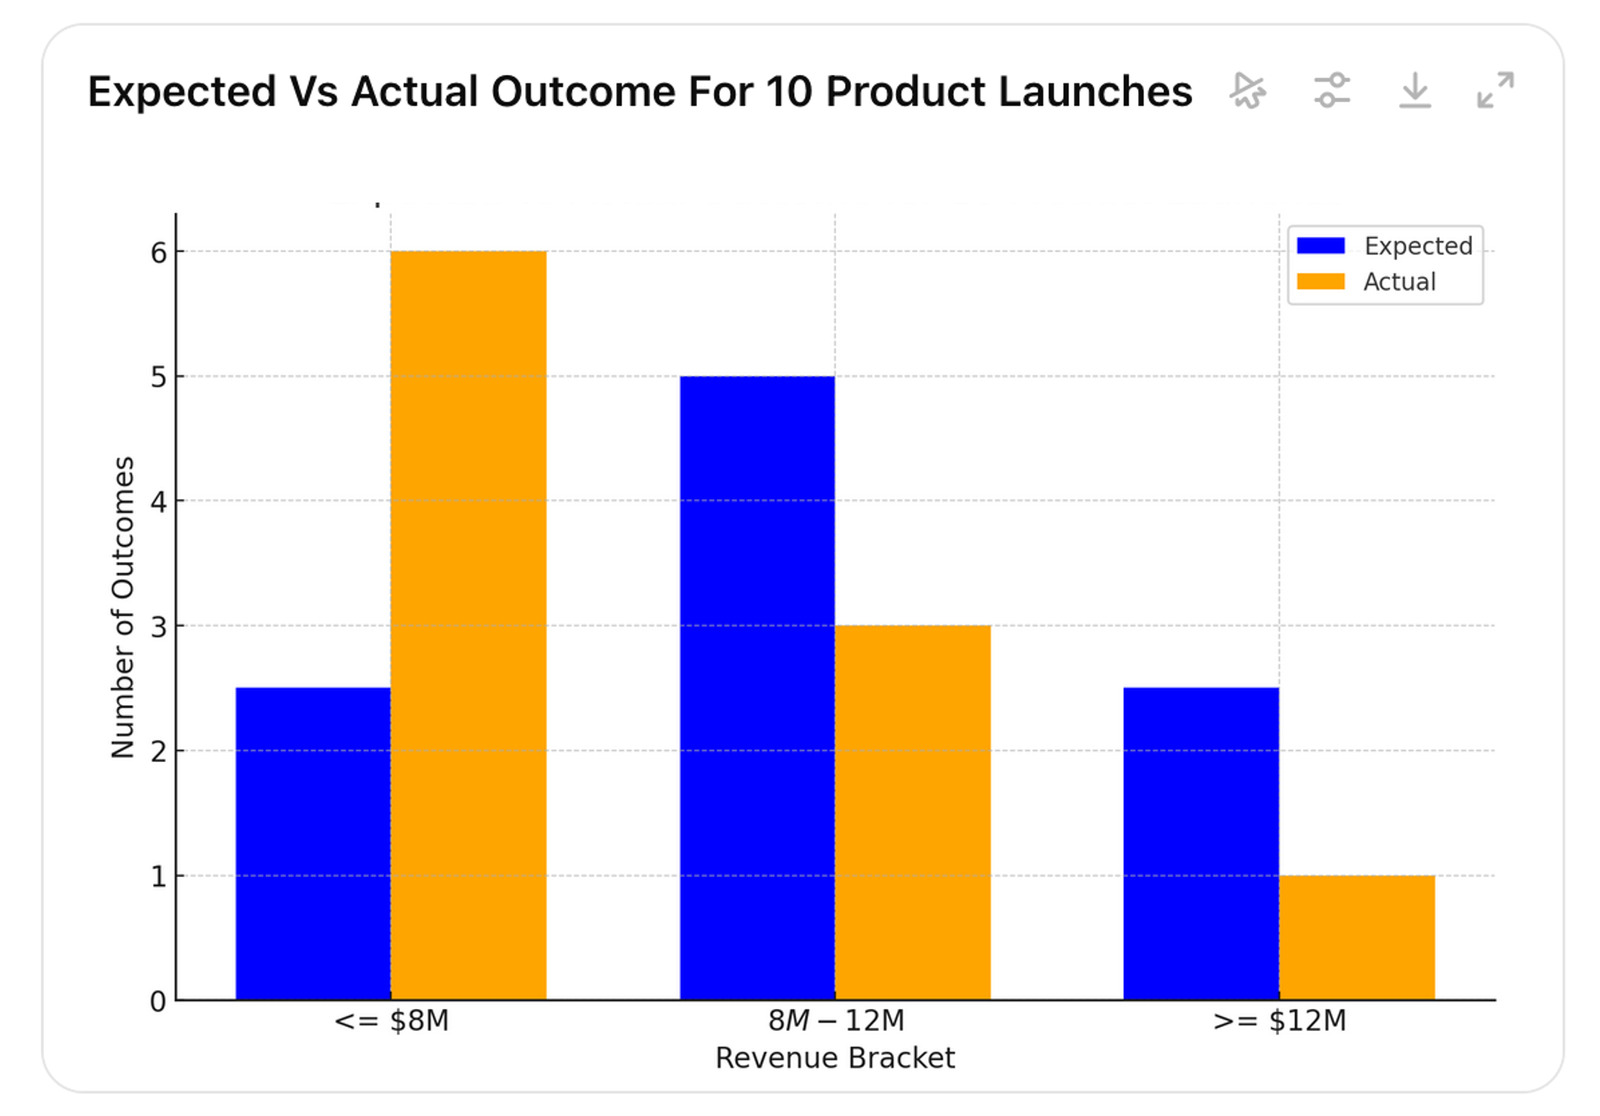
Picture 17.
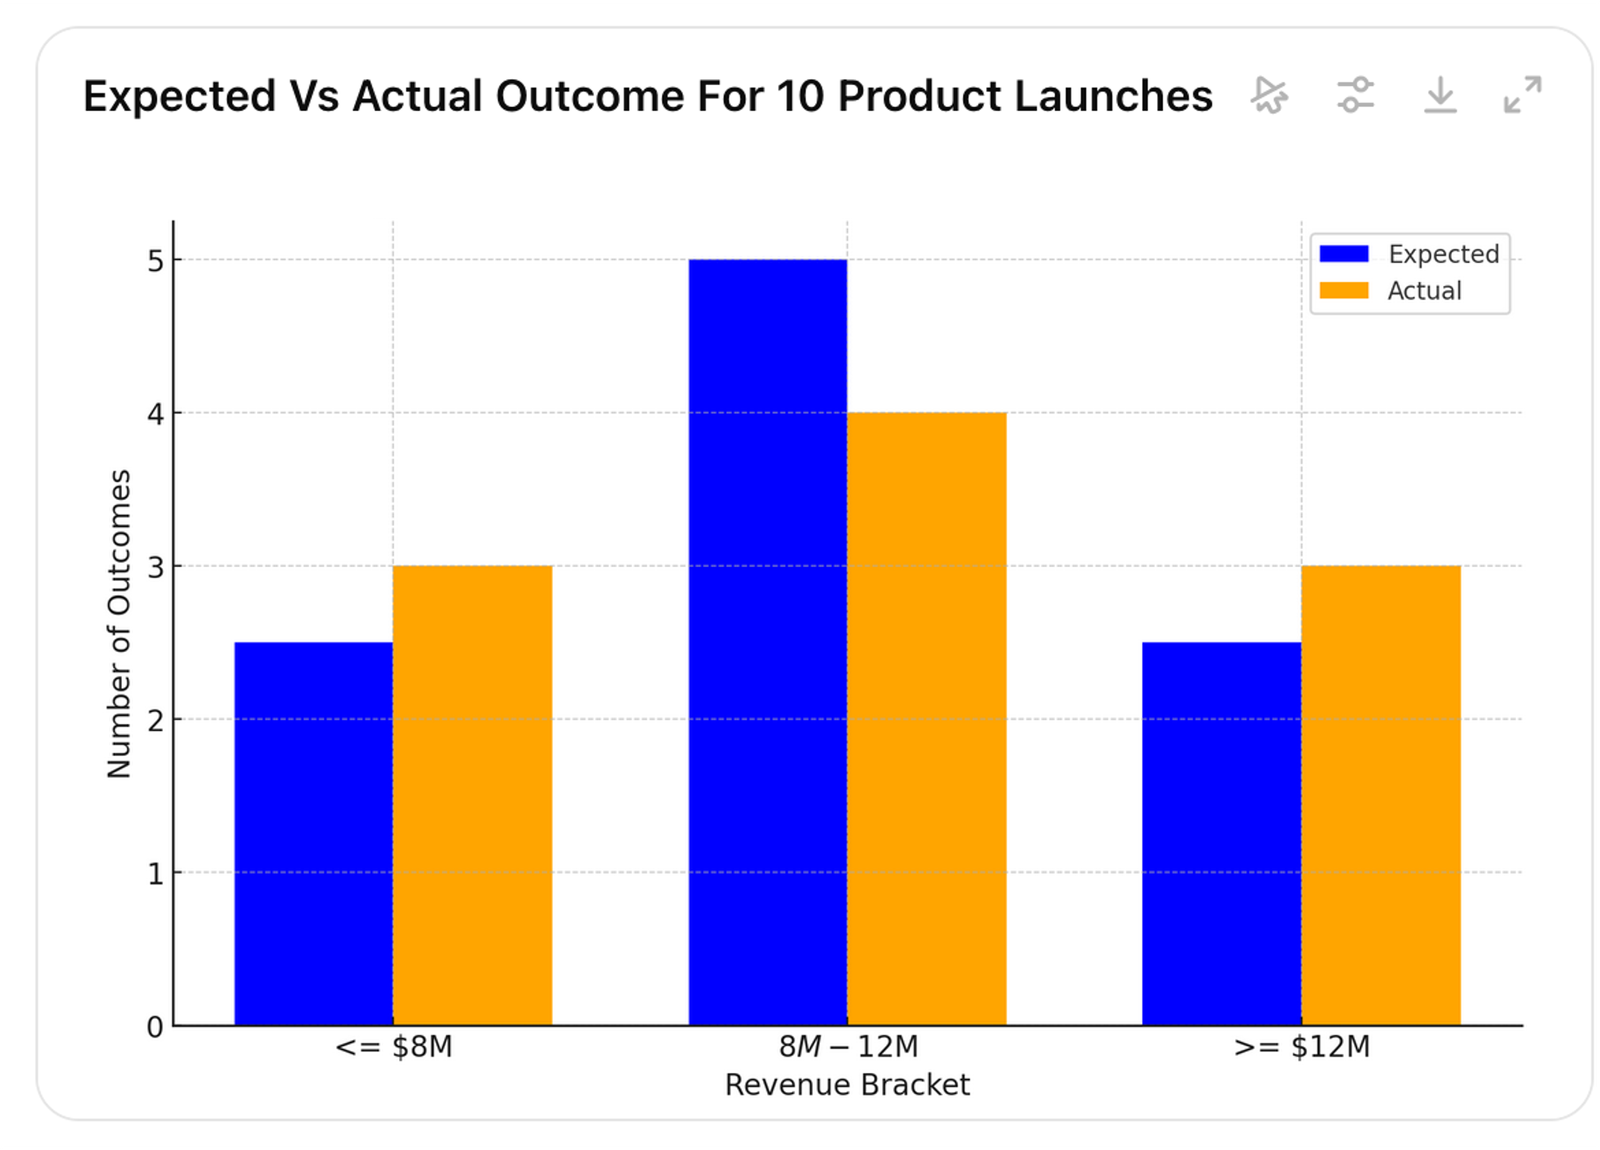
Picture 18.
Picture 19.
Picture 17 indicates that the estimated outcome is overconfident, as lower actual values occur more frequently than expected. In picture 18, actual values occur roughly as often as expected, and in picture 19, higher values occur more often than expected, indicating that the expectation is underconfident.
One could argue that, based on the graphs, it is impossible to say with high confidence—let alone certainty—whether the actual values align with the expectation.
While that is true, the key is understanding that this is not a requirement for improvement. It is simply a characteristic of the real world. While it applies to probabilistic estimates with a small number of actual values, it is even more prevalent in point estimates and single actual values.
To improve decision-making, all that is required is a higher likelihood that the gap between the estimate and the actual outcome is meaningful—rather than what the gap between a point estimate and a single actual value might suggest.
An astute reader might agree that this approach may work well for decisions that occur frequently and provide multiple data points for analysis, but what about unique decisions or those where results take a long time to materialize?
This is where using uniform probability brackets for all decisions can be useful, as they allow data to be pooled from different types of decisions. It enables conclusions to be drawn from a portfolio of decisions—say, for example, across all product launches—regardless of the probability distribution of each individual launch.
This approach can also be used to evaluate major resource allocation decisions within a business unit or a function. For example, product launches, marketing investments, and digital tools in product management and marketing.
The fact that, similar to poker, one may never be able to say decisively whether an individual decision—like a product launch, marketing campaign, or digital tool investment—was ‘good’ is irrelevant. What matters for improving performance is whether the cumulative sum of all decision outcomes improves.
So, even if one cannot ever say with 100% confidence that an $8 million outcome from a new product launch was ‘good’ or ‘bad,’ one can conclude from the outcomes of multiple product launches and marketing campaigns that resource allocations as a whole are likely over- or underconfident.
This means the company has a larger positive or negative gap to its targets than expected, allowing for better decisions to close the gap or seize opportunities.
Similarly, the same principle can be used to evaluate people’s decision-making capabilities. A CEO, for example, can better understand which business unit heads are overconfident and which are underconfident.
The benefit of this approach is that it makes the impacts of the many different biases that influence business decisions explicit.
Until AI takes over all decision-making, major business decisions will be influenced by the unconscious and conscious biases of human decision-makers. Making the effects of those biases explicit will create an incentive to reduce their influence.
The added benefit is that this approach prevents those accustomed to ‘playing the budget game’—sandbagging and misrepresenting what is really going on in the business—from exploiting probabilities.
Without explicit probabilities and learning from multiple outcomes, they could justify resources based on ‘high risk, high return’ opportunities or blame ‘low probability’ events for missed targets, making the use of probabilities harmful.
However, by requiring explicit probabilities, timelines, and tracking performance across multiple outcomes, unconscious biases or deliberate deceit will become quickly apparent.
Finally, in cases with few long-term outcomes, such as strategic decisions, one could focus on evaluating the core assumptions behind those decisions rather than just the outcomes.
For example, a company may have several key strategic choices that take years to implement and yield results. Rather than waiting years to assess how well these choices align with reality, or relying solely on financial data—which may appear favorable even when the strategy is failing—the company can measure how well its assumptions align with reality.
This way, the company could gather 10 data points in a quarter and 20 data points in half a year, indicating whether the assumptions are turning out as expected.
Since decisions and their outcomes always depend on assumptions, this approach enables the company to revise its expected outcomes and re-evaluate whether the decisions remain valid or need adjustment.
Focus on Maximizing the Expected Value Over the Long Term
Jeff Bezos in his first letter to Amazon shareholders: “It’s all about the long-term.”
Whether or not executives consider probabilities in their decision-making, a company’s long-term profits are the cumulative result of the expected values of all decisions, plus luck. And the longer the time-horizon, the smaller the relative impact of luck.
Expected value is always the product of probability and utility. Utility simply means how much you care about a given outcome, and in a business context, it’s often easy to quantify with monetary impact, like revenue or profit.
According to McKinsey, successful companies do three things.
First, those who report being long-term oriented are twice as likely to outperform competitors on growth and return on capital. Second, those who take appropriate risks with capex are 1.6 times more likely than those who report little risk to outperform on revenue growth. Third, companies that actively reallocate outperform those that don’t.
Instead of describing decision outcomes as single deterministic figures and focusing on getting decisions ‘right,’ executives should frame outcomes as the product of probability and utility, focusing on those with the highest expected value.
Consider a simplified example of three product launches.
Let’s say the organization has the resources to launch two new products. Which ones should it choose? Based on traditional point estimates, it might select products #1 and #2, as the assumed probability in the estimated profit is 100% (Table 2).

Table 2.
However, when the real probabilities are considered, the company would be better off launching products #2 and #3, which would increase the expected value by 20%. In other words, over the long term, the company’s profits would rise by that amount. (Table 3).
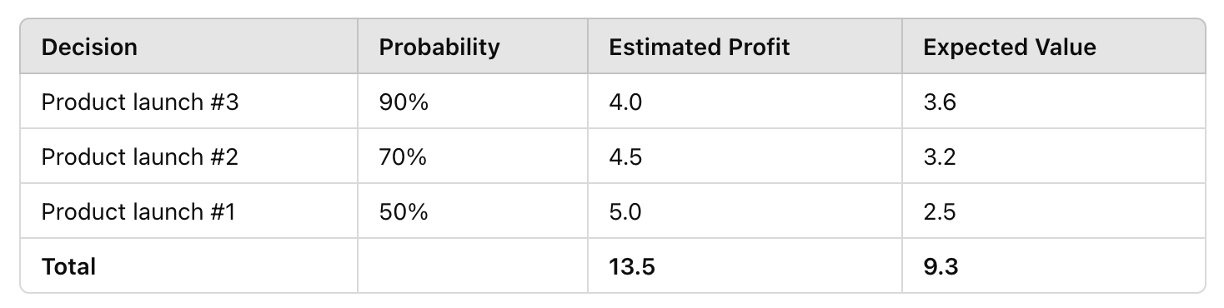
Table 3.
At a company level, this means allocating resources to the business units, functions, or initiatives that improve the expected value of the overall portfolio.
Since all business decisions are connected by financial resources, product launches, for example, must compete with investments in digital tools.
Rather than focusing on ‘hitting’ a static, siloed budget for each business unit or function, companies should continuously update the expected values of their decision portfolios and actively reallocate resources to those with the highest expected returns.
For example, reallocating $10 million from digital tools to product launches could improve the portfolio’s expected value by 4% (Table 4).
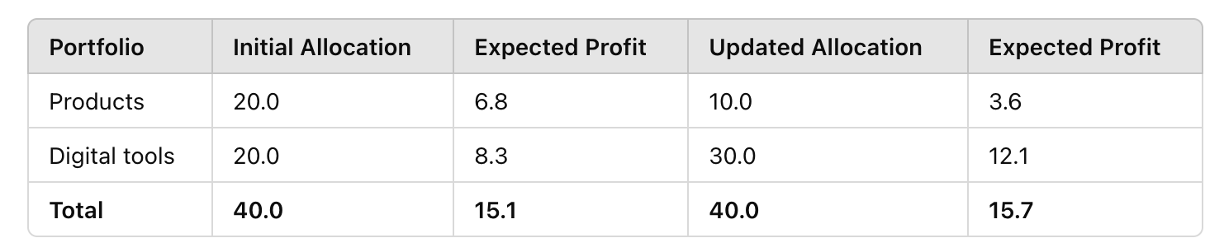
Table 4.
Further, although short-term profits are typically more certain and long-term outcomes more uncertain (such as the impacts of cutting marketing costs), companies can improve their ‘odds to win’ by evaluating expected values over time.
For instance, let’s say the expected values in the previous example were calculated over a three-year period. However, the costs and benefits might occur over different timeframes (Table 5).

Table 5.
By making different decisions, the organization can change its year 1 and year 3 expected profits by several millions, depending on which one it chooses to prioritize.
Focusing on maximizing the expected value over the long term also opens up opportunities for ‘big moves’ that come with greater risks.
With traditional thinking, one would never take a bet with only a 10% chance of success. Even if they did, after failing a few times, they would likely stop and stick with bets where the payoff is low but probable and achievable in the short-term.
With probabilistic thinking, however, one could take the 10% chance of a 100x payoff every time, even if it meant being ‘wrong’ 9 times out of 10.
A common misconception about being ‘long-term oriented’ is that it means neglecting the short term. In reality, it’s the opposite. While ‘short-term orientation’ does indeed typically neglect the long term, focusing on the long term simply means not neglecting it, or put differently, it merely means accounting for ‘all the terms.’
To Improve Odds or Not to Improve
According to Larman’s laws of organizational behavior, people often ridicule new ideas as ‘theoretical’ and prefer to rebrand existing practices rather than make real changes, claiming ‘that’s what we’re already doing,’ even when they aren’t.
Since probabilistic thinking is non-intuitive and hard, and challenges the norm, these mechanisms are particularly prevalent in this area, so it’s worth briefly addressing them here.
First, it’s natural to think, ‘that’s what we’re already doing.’ After all, who wouldn’t (1) acknowledge the world is unpredictable, (2) try to understand real-world factors impacting decisions, (3) learn from multiple outcomes over time, or (4) aim to maximize expected value over the long term?
Most executives are, of course, capable of doing all of the above. However, without incorporating probabilistic thinking into their actions, they are bound to make worse decisions than they could.
In other words, without probabilistic thinking, (1) choosing the right decisions, (2) reallocating resources, and (3) balancing short- and long-term tradeoffs are based on less effective information than is available in practice, ultimately decreasing ‘the odds to win.’
Despite what they might believe, executives may not be acting in line with probabilistic thinking.
Here’s a simple test: anyone running an ABP and setting static targets from it is acting counter to probabilistic thinking, as annual static plans created 12 months in advance are prime examples of deterministic thinking and single-loop learning.
In contrast, in the words of Harvard professor, “genuine learning involves an extra step, in which you reflect on your assumptions and test the validity of your hypotheses. Achieving this double-loop learning is more than a matter of motivation—you have to reflect on the way you think.”
Executives with a single-loop mindset might say: “Of course I understand that the world is unpredictable, but we still need to ‘hit the budget,’” which is like a person wanting to lose weight saying: “Of course, I understand that I need to be in a caloric deficit, but I’m still going to eat cookies.”
Indeed, believing you’re thinking probabilistically while obsessing over static plans is like believing you’re operating in a free market where the government sets prices.
Practical insights
- Focus on improving the ‘odds to win’ rather than ‘hitting’ point estimates.
- Learn the basics of probabilistic thinking to improve performance.
- Describe decision outcomes and assumptions using probabilities.
- Learn from multiple outcomes over time instead of single outcomes.
- Focus on increasing expected value over the long term.